
Diagrams and computational efficiency
Diagrams and computational efficiency
The concept of computational efficiency helps explain why diagrams work so well.
I’ve just written an article on Using the computational efficiency of diagrams to help learners learn.
You can read the full article here. Below is a summary.
Article summary
Click on the image below to see the full-size version.
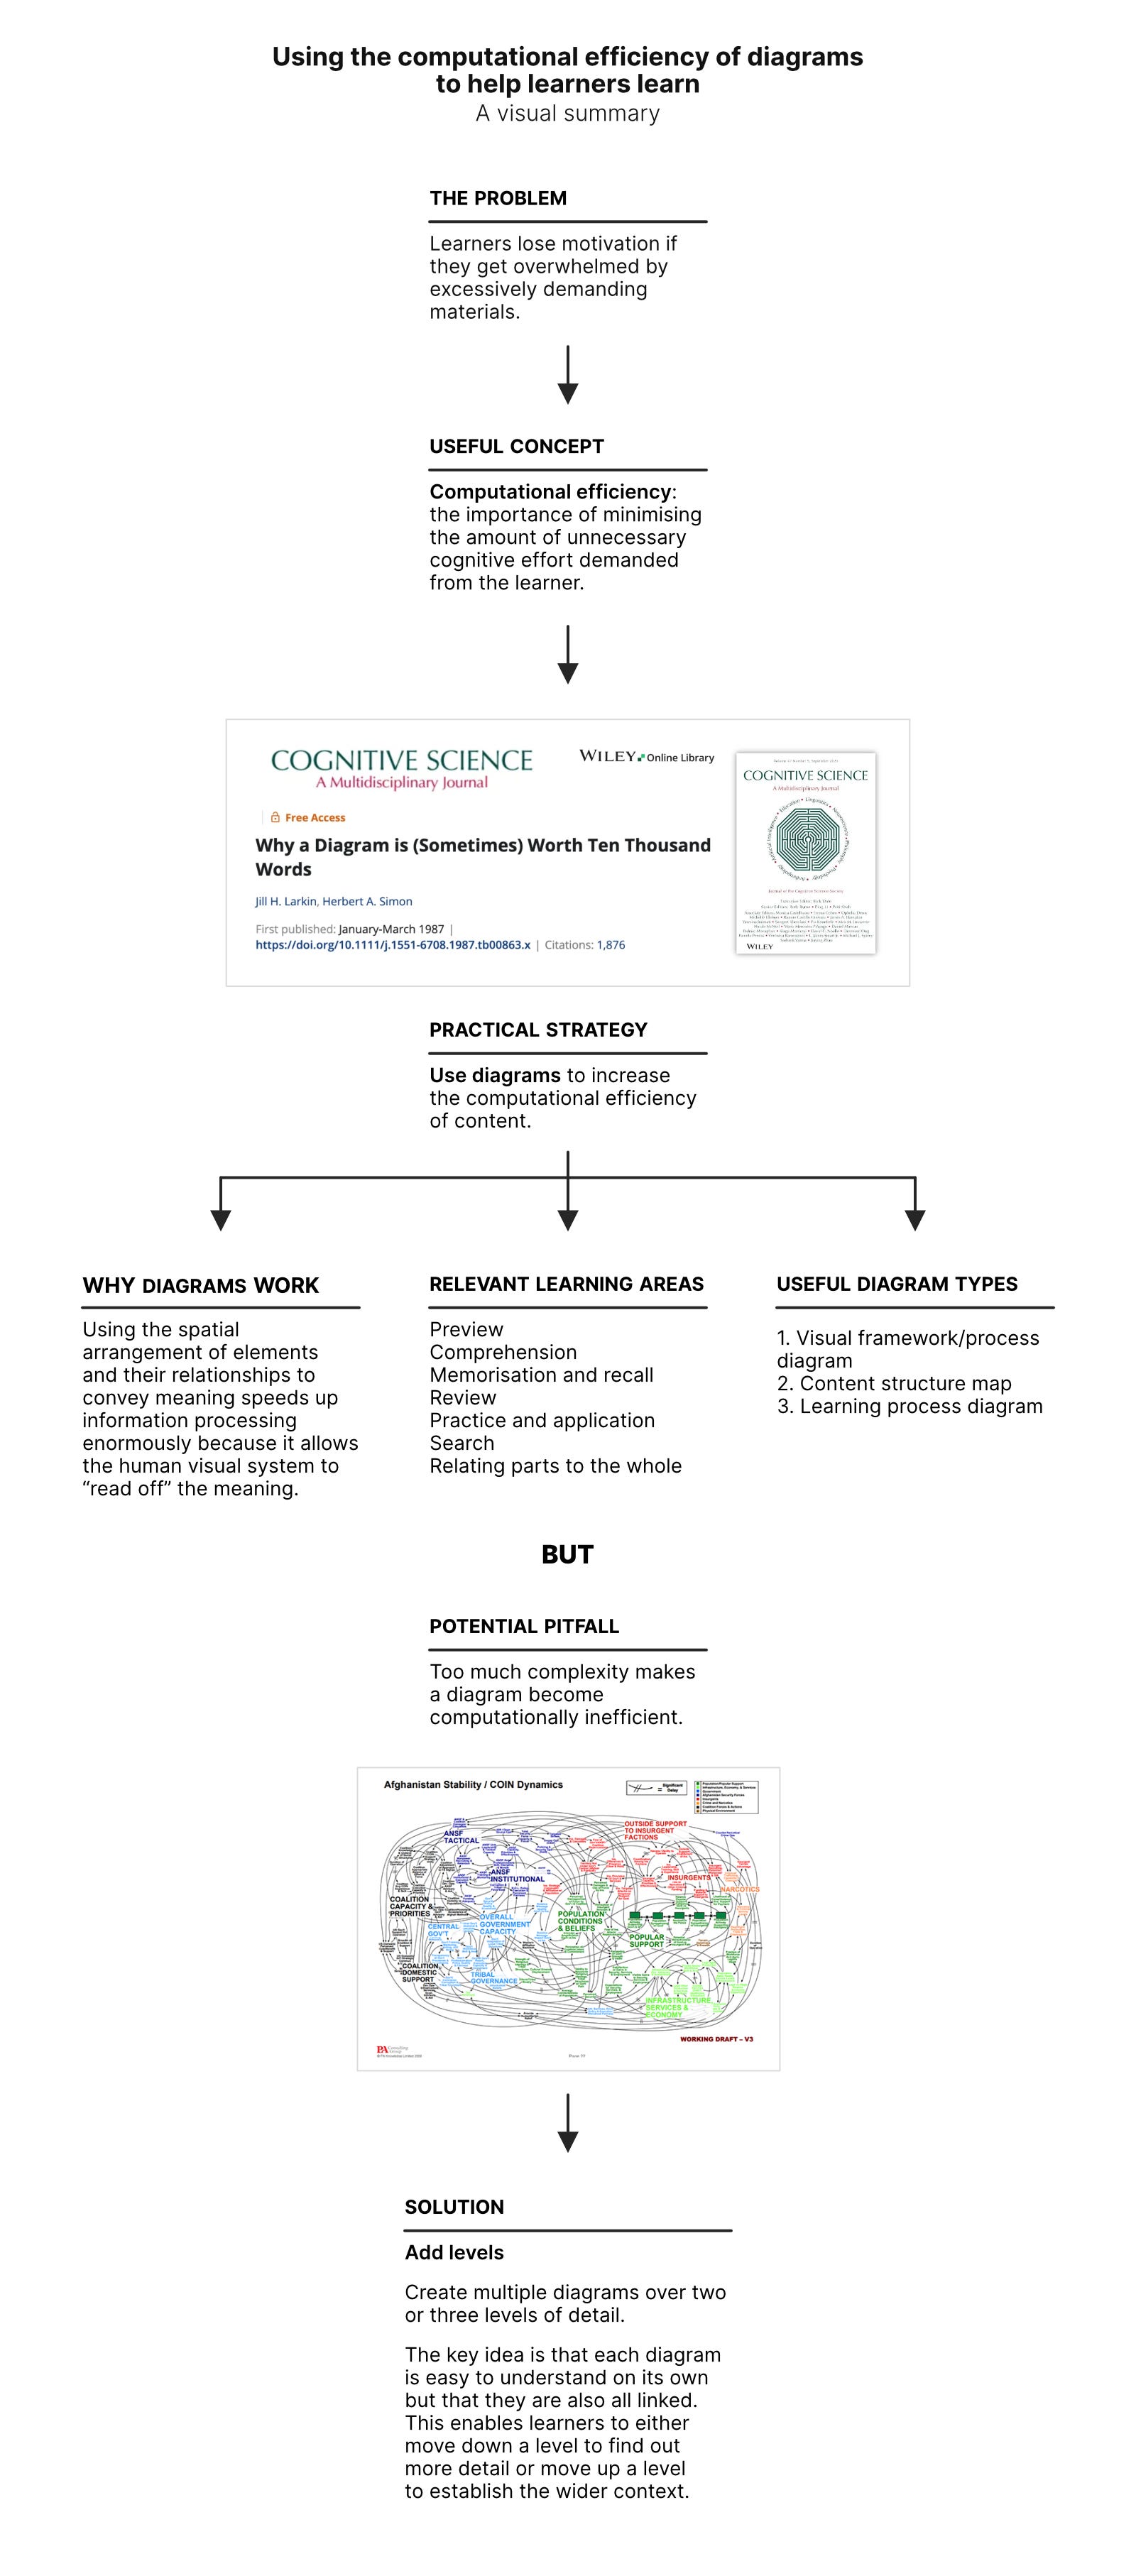
Computational efficiency is an incredibly important concept for any educator or writer. It was discussed in a neglected 1987 paper 'Why a Diagram is (Sometimes) Worth Ten Thousand Words' by cognitive scientist Jill Larkin and economics Nobel prize winner Herbert Simon.
The main idea of the paper is that different types of communication demand different levels of cognitive effort from learners and that, in many instances, diagrams can be more computationally efficient than text.
The linear nature of the written word means that learners have to sequentially construct their own understanding of how the different elements of an explanation relate to each other as they go through the content. This can often be quite cognitively demanding.
With diagrams, using the spatial arrangement of elements and their relationships to convey meaning speeds up information processing enormously because it allows the human visual system to “read off” the meaning.
Of course there are limits to the computational efficiency of diagrams. One of the commonest problems is having an overly complex diagram which overwhelms the processing capacity of the learner.
A famous example is a causal loop diagram which analysed the US’s counter-insurgency strategy in Afghanistan in 2009. As Gen McChrystal, the US /NATO commander in Afghanistan at the time, was said to have remarked: “When we understand that slide, we’ll have won the war!”.
There’s a simple solution to excessive complexity: creating multiple diagrams over two or three levels of detail. On the top level you show how the most important topics are related — and then on lower levels you go into more detail for each topic.
The key idea is that each diagram is easy to understand on its own but that they are also all linked. This enables learners to either move down a level to find out more detail or move up a level to establish the wider context.
As ever, I’d be delighted to hear from you if you have any comments. Just reply to this email.
Francis
Francis Miller